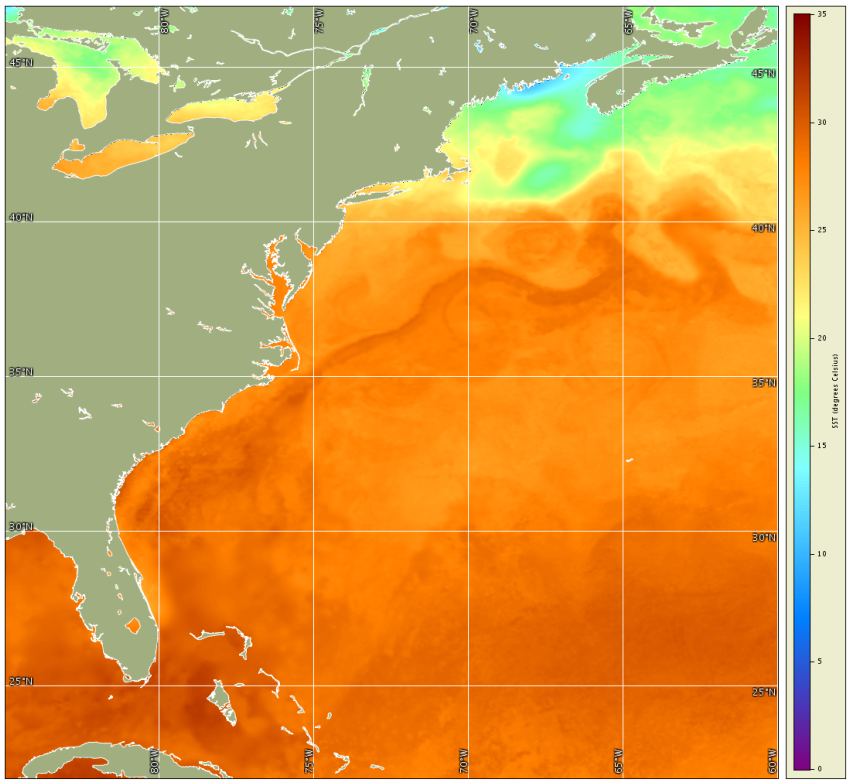
Figure: PODAAC MUR SST for July 30, 2015
Data Set Validation:
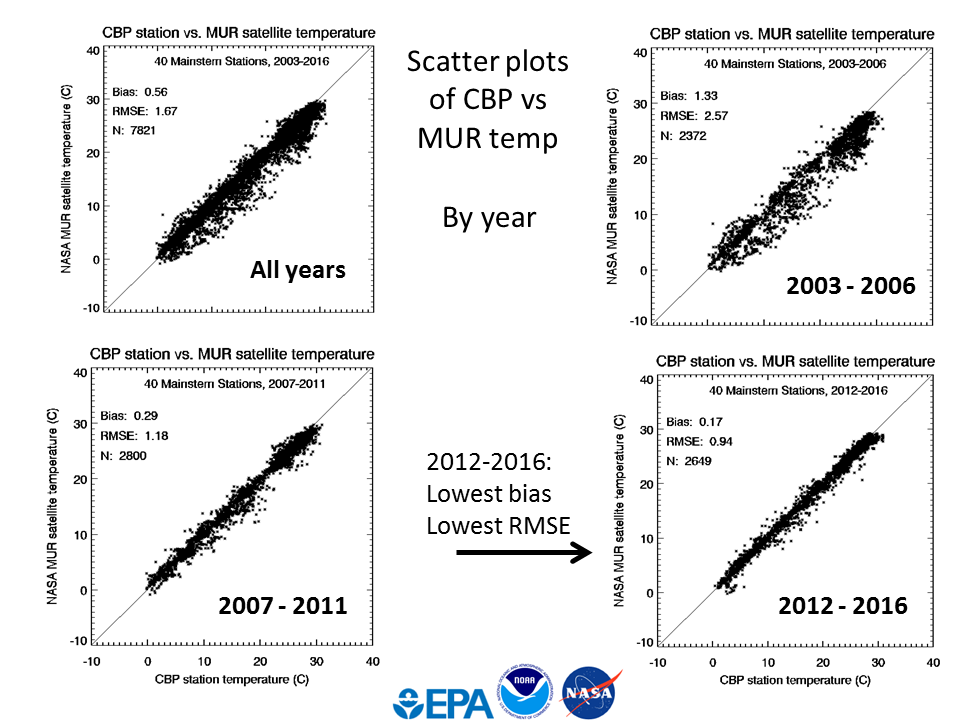
In an effort to understand satellite SST accuracy in estuaries,
NOAA CoastWatch East Coast Node validated the PODAAC MUR SST version 4.1,
using in-situ data from Chesapeake Bay. In-situ monthly water
quality monitoring data were obtained from the
Chesapeake Bay Program (CBP) for the years 2003-2016 for 40 stations
in the Chesapeake Bay's main stem. Only CBP surface data was used.
A MUR SST 3x3 grid cell average was
calculated for each station's location and day of data collection, resulting
in 7821 match-up pairs.
Match-up pairs sorted by year show that later years have smaller bias
and smaller RMSE:
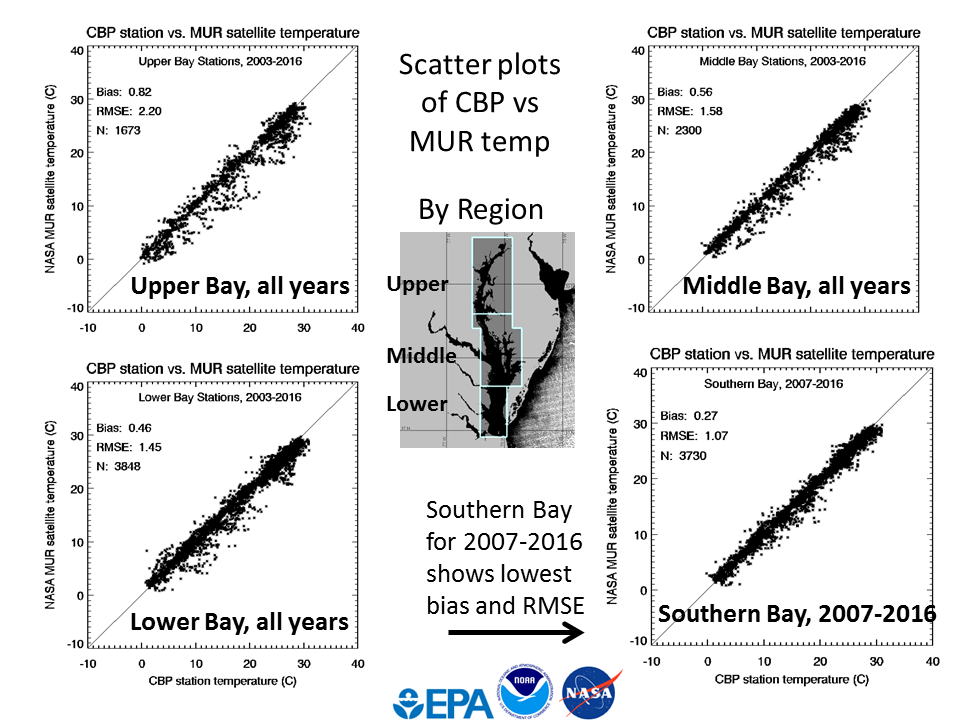
Match-up pairs sorted by region show that the southernmost region
has the smallest bias and smallest RMSE:
Annual averages at three CBP stations show that earlier years and the
northern stations have distinct low SST values in the MUR SST data, compared
to the CBP annual averages:
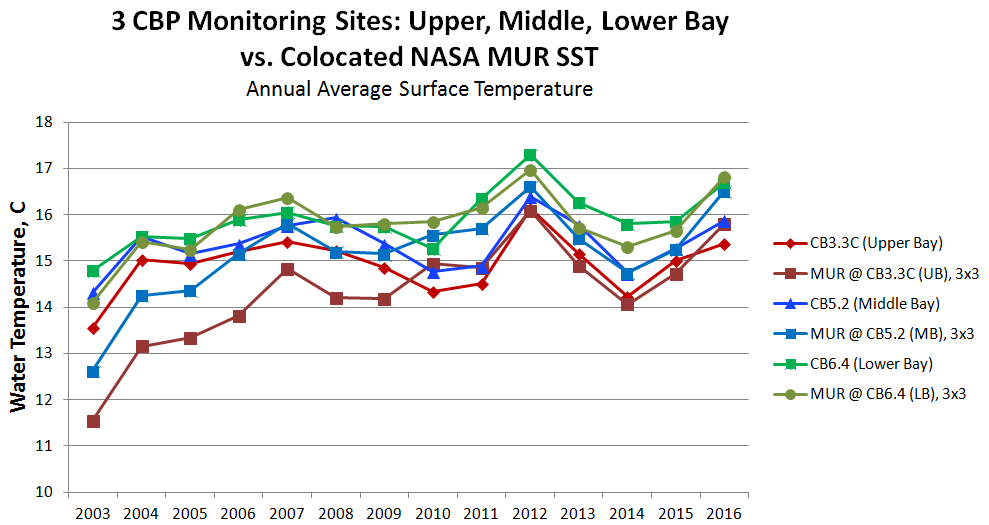
The low bias is due to older versions of several input satellite
data sets for the earlier years (2002-2006) used by PODAAC in
generating the MUR data set.
As a result, for estuarine subsets (for example, Long Island Sound), NOAA
CoastWatch East Coast Node only makes the years 2007 and forward
available, representing the time period with the least bias comparied
to the in-situ data.
Additionally, for Chesapeake Bay, only the southern portion of the Bay is
used for calculating the time series statistics. For other estuaries,
the entire estuary's spatial extent is used in the time series statistics.
Other MUR SST Validation Activities:
Castro, S.L., G.A. Wick, and M. Steele. 2016.
Validation of satellite sea surface temperature analyses in the Beaufort Sea
using UpTempO buoys, Remote Sensing of Environment, vol. 186, 458-475,
http://doi.org/10.1016/j.rse.2016.10.035
|